Create, analyze and manipulate a dataset
Measurement data formats depend on many aspects such as the specific application domain, the logging system, the manufacturer, and so on. Due to this variability, it is impossible to establish a unified measurements format that fits every domain. Each domain has its own requirements. Therefore, we need to find a solution.
Dymoval defines a Signal object type that is general enough to capture all the aspects of a signal, regardless of its application domain. At the end, when dealing with a time-serie, we are interested in the following attributes:
signal name,
signal values,
signal units,
sampling period,
time unit.
A Signal object store exactly this information and can be created as it follows:
from dymoval.dataset import Signal
from numpy.random import default_rng

# Generate random temperature values
signal_values = default_rng().uniform(low=15, high=25, size=100)
# Create a dymoval Signal
room_temperature: Signal ={
        "name": "my room temperature",
        "samples": signal_values,
        "signal_unit": "Celsius",
        "sampling_period": 120,
        "time_unit": "s",
        }
As a first step when using dymoval, each logged signal must be cast into a dymoval Signal. Once this is done, a list of such Signals can be used to create a Dataset object. This represents the measurement dataset against which the simulated outputs will be evaluated.
To create a Dataset object, we need at least one input and one output, therefore we assume that the room temperature of the previous example is an output and a thermostat position is the input signal:
# ...continued
import numpy as np
from dymoval.dataset import Dataset
# Generate random thermostat position
thermostat_pos = np.concatenate((np.ones(20), np.zeros(40), np.ones(40)))
# Create a dymoval Signal
thermostat_pos_values: Signal ={
        "name": "thermostat_position",
        "samples": thermostat_pos_values,
        "signal_unit": "",
        "sampling_period": 120,
        "time_unit": "s",
        }
input_name = thermostat_pos['name']
output_name = room_temperature['name']
# Create the actual Dataset object
ds = Dataset("my dataset", [thermostat_pos, room_temperature] , input_name, output_name)
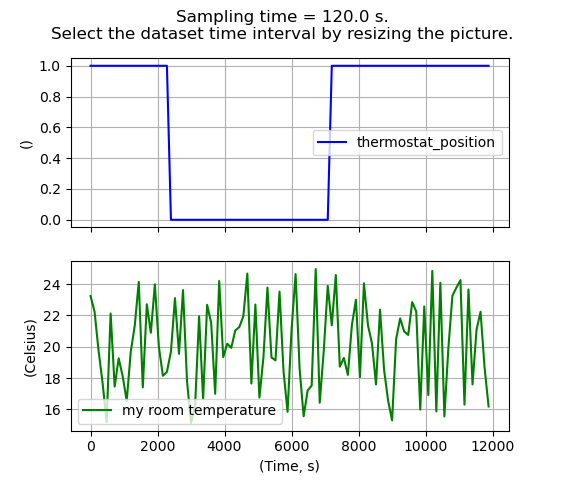
You should get a figure like the following:
At this point you can graphically trim the time-axis to select only a desired portion of measurements data that you want to use for validation purpose:
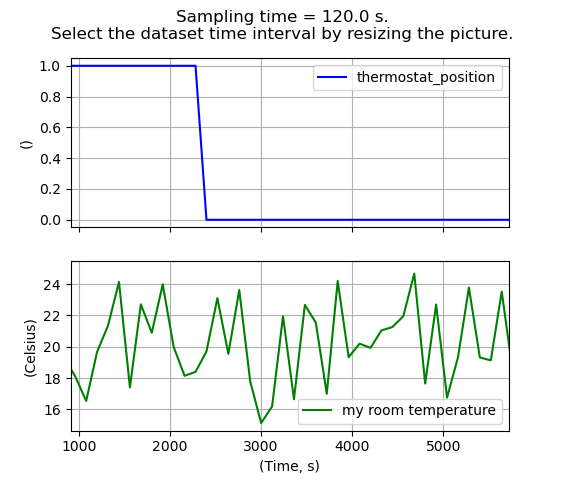
Note
Visual trimming of the Dataset object is allowed only if
you are using an interactive matplotlib backend like qtagg.
However, if you are not using an interactive backend, you can still trim
your Dataset object by passing the arguments tin and tout to the
constructor or by passing them to the trim()
method.
It is worth mentioning that when dealing with measurement datasets, several problems arise:
Signals may be sampled at different rates.
Data loggers may run continuously for hours, logging data even when nothing interesting is happening, resulting in large log files with little information.
Logs are often affected by other issues such as noisy measurements, missing data, and so on.
Dymoval provides a number of functions for dealing with Dataset objects, including re-sampling, plotting, frequency analysis, filtering, and more.
Once you have created and adjusted a measurement Dataset object, you are ready to simulate your model.